Results:
The Soleus and EDL both had distinct results from their relative force in percentage or decimal form. In the figures, all the groups, animals are combined data since our sample size was so small. In Figure 1, Soleus fatigue of the control group was significantly lower than baseline at (P<0.05). Fatigue of the Dox group was significantly low ranging at ~0.87 compared to the control at ~0.90. The Creatine group was the most significant data at ~0.96 in correspondence to relative force over time. The Creatine and Dox group had no significant changes to the control group staying around 0.87. In Figure 2, EDL fatigue of the control group was shown as the highest in relative force at ~0.90, which is abnormal. The Dox group was significantly lower compared to the control staying around 0.70. The Creatine group was not significantly lower compared to the control; they were about 0.05 away from being equivalent. The Creatine-Dox group was not significantly lower than the control, at ~0.80, but higher than the Dox group. In Figure 3, the maximal twitch value of the Soleus was determined. The Creatine-Dox group had the highest in maximal force twitch of ~9 grams, followed by the Creatine group of ~6 grams, the control of ~5.5 grams, and the Dox group of ~4.8 grams. This shows that the Creatine-Dox group had not been damaged by the Dox during testing. The maximal twitch value of the EDL is shown in Figure 4. The Creatine group was the highest, at ~11.5 grams, and the other groups were almost all equivalent, ranging around 5 grams of force. In Figure 5, the MDA content of the Soleus is shown in μM. The Creatine-Dox group was the highest for lipid peroxidation, at ~2.3 μM followed by the Dox group of ~2 μM. The control and Creatine group were lower and around the same value of ~1.5 μM. The MDA (Malonaldehyde) content of the EDL is shown in Figure 6. The Dox group was significantly high for lipid peroxidation at ~2 μM . The control, Creatine, and Creatine-Dox group are almost equivalent, at ~0.9 μM, and significantly lower than the Dox group.
The Soleus and EDL both had distinct results from their relative force in percentage or decimal form. In the figures, all the groups, animals are combined data since our sample size was so small. In Figure 1, Soleus fatigue of the control group was significantly lower than baseline at (P<0.05). Fatigue of the Dox group was significantly low ranging at ~0.87 compared to the control at ~0.90. The Creatine group was the most significant data at ~0.96 in correspondence to relative force over time. The Creatine and Dox group had no significant changes to the control group staying around 0.87. In Figure 2, EDL fatigue of the control group was shown as the highest in relative force at ~0.90, which is abnormal. The Dox group was significantly lower compared to the control staying around 0.70. The Creatine group was not significantly lower compared to the control; they were about 0.05 away from being equivalent. The Creatine-Dox group was not significantly lower than the control, at ~0.80, but higher than the Dox group. In Figure 3, the maximal twitch value of the Soleus was determined. The Creatine-Dox group had the highest in maximal force twitch of ~9 grams, followed by the Creatine group of ~6 grams, the control of ~5.5 grams, and the Dox group of ~4.8 grams. This shows that the Creatine-Dox group had not been damaged by the Dox during testing. The maximal twitch value of the EDL is shown in Figure 4. The Creatine group was the highest, at ~11.5 grams, and the other groups were almost all equivalent, ranging around 5 grams of force. In Figure 5, the MDA content of the Soleus is shown in μM. The Creatine-Dox group was the highest for lipid peroxidation, at ~2.3 μM followed by the Dox group of ~2 μM. The control and Creatine group were lower and around the same value of ~1.5 μM. The MDA (Malonaldehyde) content of the EDL is shown in Figure 6. The Dox group was significantly high for lipid peroxidation at ~2 μM . The control, Creatine, and Creatine-Dox group are almost equivalent, at ~0.9 μM, and significantly lower than the Dox group.
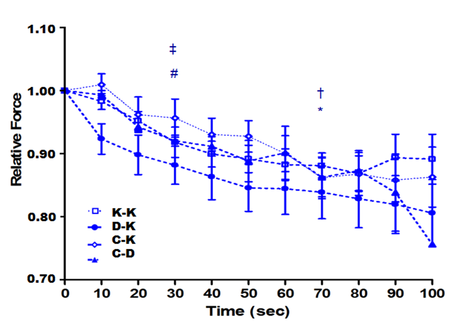
Figure 1. Soleus fatigue
† K-K, significantly lower than baseline (P<0.05) ‡D-K, significantly lower than baseline (P<0.05) * C-K, significantly lower than baseline (P<0.05) # C-D, significantly lower than baseline (P<0.05) |
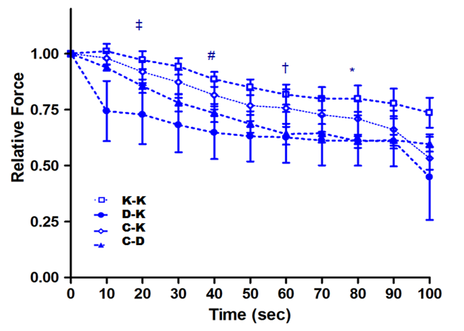
Figure 2. EDL Fatigue
† K+K, significantly lower than baseline (P<0.05) ‡ K+DOX, significantly lower than baseline (P<0.05) * Cr+K significantly lower than baseline (P<0.05) # Cr+DOX, significantly lower than baseline (P<0.05) |
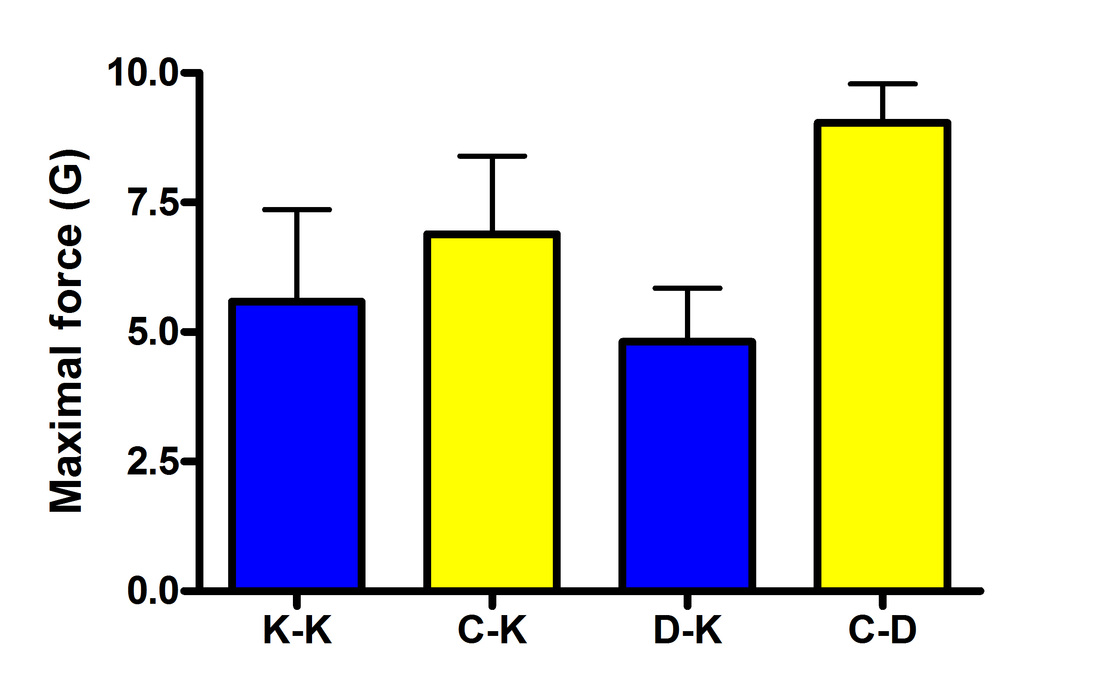
FIGURE 3. Maximal force achieved during fatigue protocol for Soleus.
|
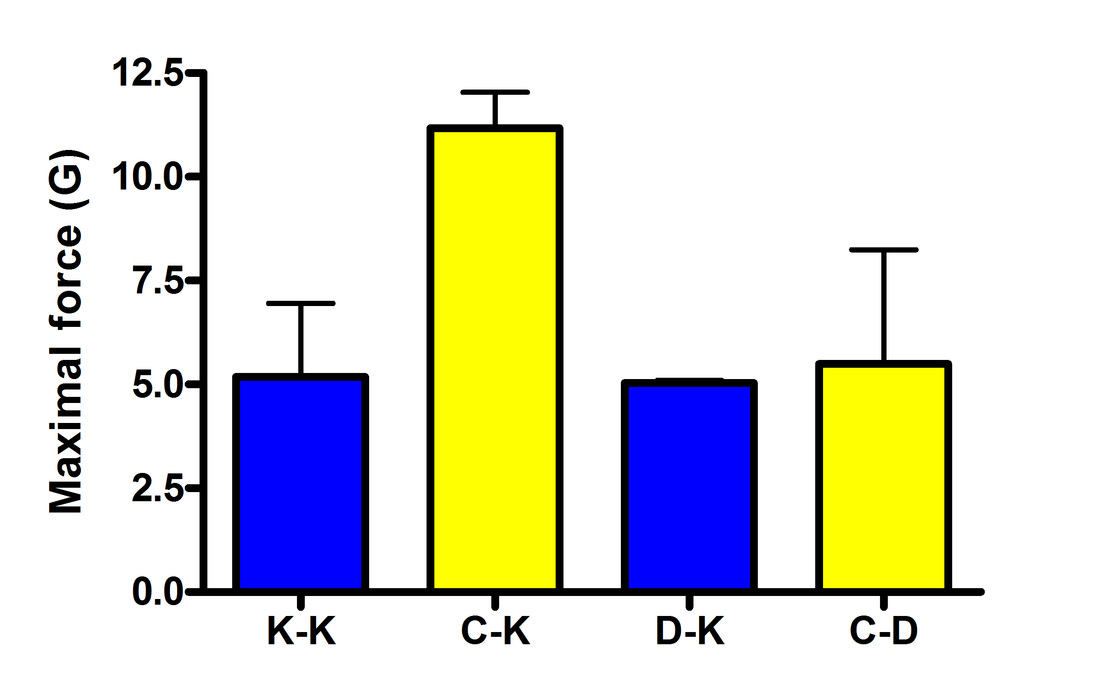
FIGURE 4. Maximal force achieved during fatigue protocol for EDL.
|
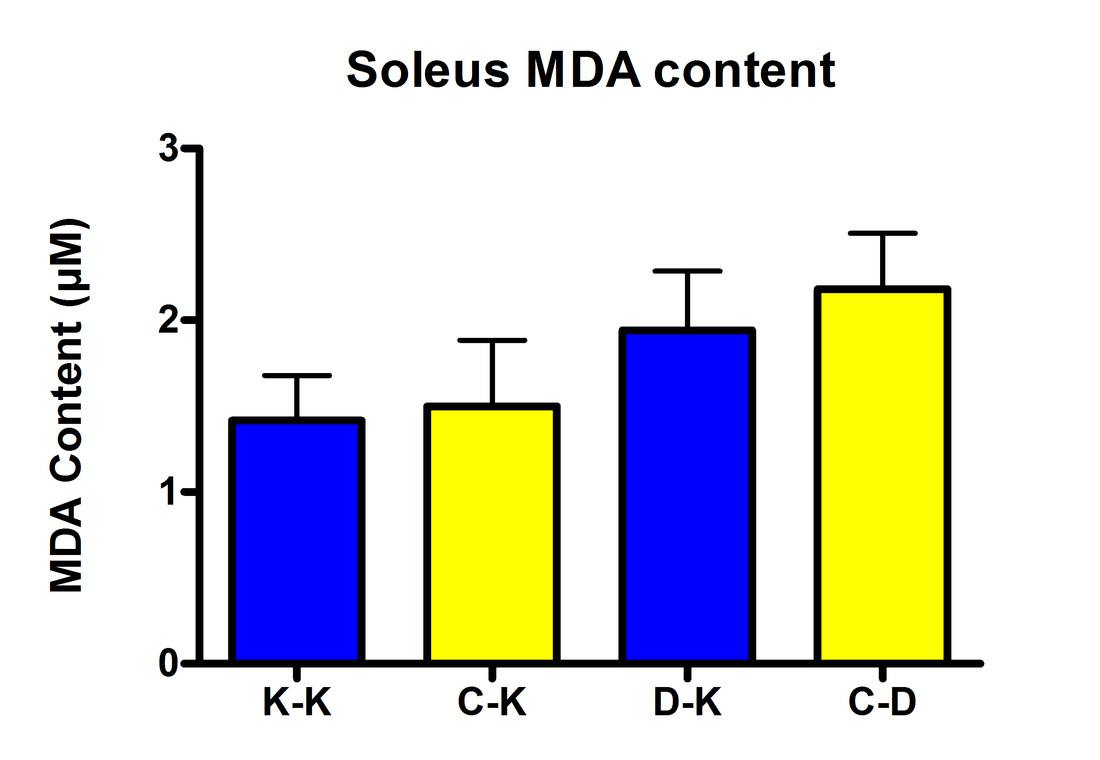
FIGURE 5. Markers of lipid peroxidation in the soleus.
|
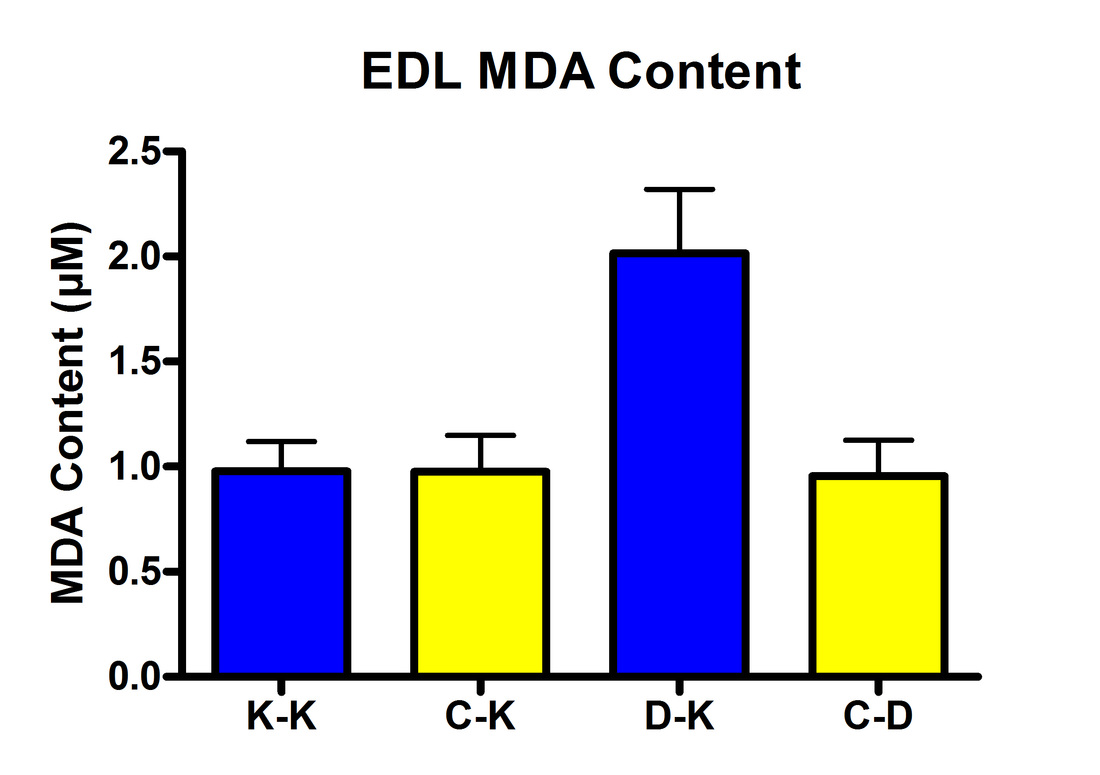
FIGURE 6. Markers of lipid peroxidation in the EDL.
|
Discussion:
The Krebs buffer did not improve or harm the muscle because it was the control. The Creatine buffer did increase maximal force in twitch. As a result of absorbing the creatine more ATP was produced giving the muscle more fuel and a better twitch. The Dox buffer increased fatigue in both the Soleus and EDL showing that it does cause a negative impact. The Creatine-Dox buffer was better at not fatiguing. This shows that the Creatine did have an effect on how the Dox buffer interacted with the muscles. The Soleus data shows that creatine was not as effective as a pretreatment to Dox. EDL data shows that creatine did effectively work as a pretreatment. This may because type 2 (slow twitch) fibers have higher levels of phosphocreatine versus a type 1 fiber. Daily activities would not be as difficult if Creatine can neutralize Dox in the EDL. The MDA of the Soleus Creatine-Dox group was very high when it should have not been. This shows more damage when it is higher. This is because of the same reason as before; type 1 fibers do not absorb as much creatine. The MDA of the Creatine group in both muscles stayed very close to the controls data because no damage was done. Since our sample sizes are so small our data was not as close as it could have came out if we had more time. My hypothesis was proven wrong in the Soleus because this muscle fiber type did not use as much creatine as the EDL did. In previous research this hypothesis was proven correct (Greenaway & Chan, 2009).
The Krebs buffer did not improve or harm the muscle because it was the control. The Creatine buffer did increase maximal force in twitch. As a result of absorbing the creatine more ATP was produced giving the muscle more fuel and a better twitch. The Dox buffer increased fatigue in both the Soleus and EDL showing that it does cause a negative impact. The Creatine-Dox buffer was better at not fatiguing. This shows that the Creatine did have an effect on how the Dox buffer interacted with the muscles. The Soleus data shows that creatine was not as effective as a pretreatment to Dox. EDL data shows that creatine did effectively work as a pretreatment. This may because type 2 (slow twitch) fibers have higher levels of phosphocreatine versus a type 1 fiber. Daily activities would not be as difficult if Creatine can neutralize Dox in the EDL. The MDA of the Soleus Creatine-Dox group was very high when it should have not been. This shows more damage when it is higher. This is because of the same reason as before; type 1 fibers do not absorb as much creatine. The MDA of the Creatine group in both muscles stayed very close to the controls data because no damage was done. Since our sample sizes are so small our data was not as close as it could have came out if we had more time. My hypothesis was proven wrong in the Soleus because this muscle fiber type did not use as much creatine as the EDL did. In previous research this hypothesis was proven correct (Greenaway & Chan, 2009).
